Mpl Canvas Example
An example of embedding a maplotlib plot inside an Enaml application.
Tip
To see this example in action, download it from
mpl_canvas
and run:
$ enaml-run mpl_canvas.enaml
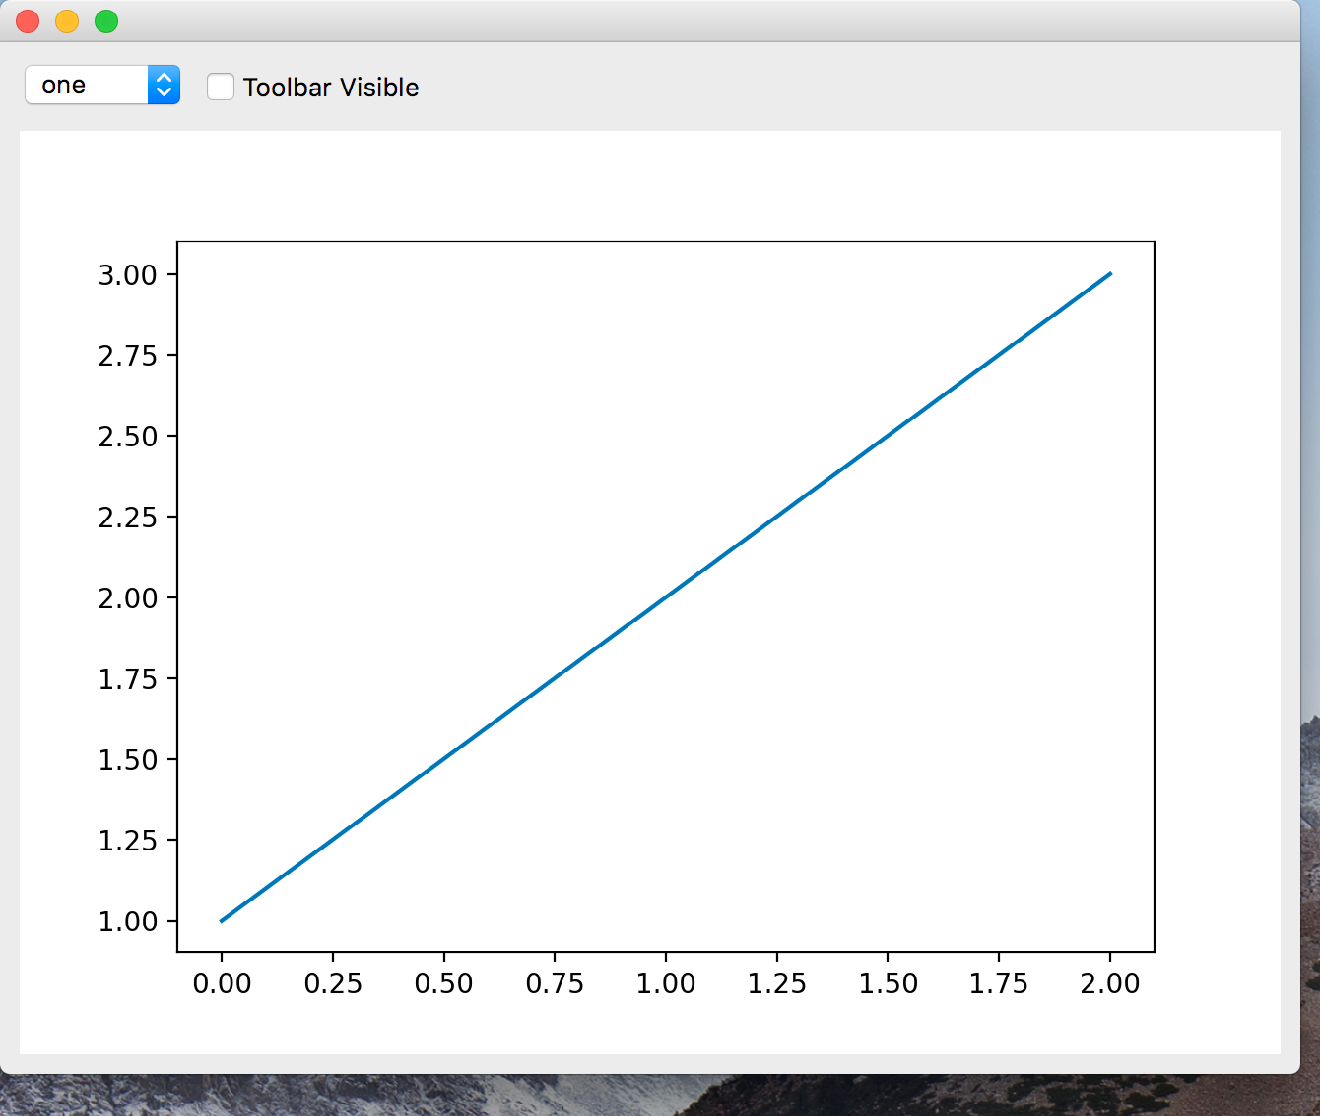
Screenshot
Example Enaml Code
#------------------------------------------------------------------------------
# Copyright (c) 2013, Nucleic Development Team.
#
# Distributed under the terms of the Modified BSD License.
#
# The full license is in the file LICENSE, distributed with this software.
#------------------------------------------------------------------------------
""" An example of embedding a maplotlib plot inside an Enaml application.

<< autodoc-me >>
"""
from enaml.layout.api import vbox, hbox, spacer
from enaml.widgets.api import Window, Container, MPLCanvas, CheckBox, ComboBox

from matplotlib.figure import Figure


fig1 = Figure()
ax1 = fig1.add_subplot(111)
ax1.plot([1, 2, 3])

fig2 = Figure()
ax2 = fig2.add_subplot(111)
ax2.plot([5, 2, 8, 1])

figures = {
    'one': fig1,
    'two': fig2,
}


enamldef Main(Window):
    Container:
        constraints = [
            vbox(
                hbox(cbox, check, spacer),
                canvas,
            ),
            cbox.v_center == check.v_center,
        ]
        ComboBox: cbox:
            items = ['one', 'two']
            index = 0
        CheckBox: check:
            text = 'Toolbar Visible'
            checked := canvas.toolbar_visible
        MPLCanvas: canvas:
            figure << figures[cbox.selected_item]